
The 90-Day Producer CPS Curve and When to Trust It
By Craig Pretzinger and Jason Feltman
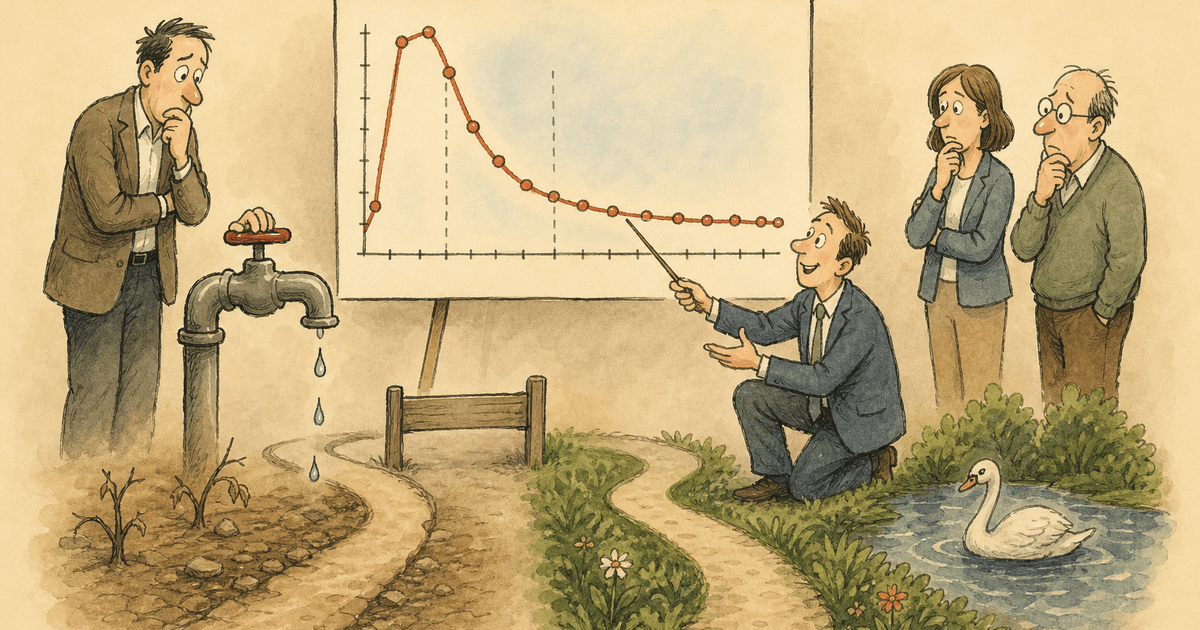
New producer cost per sale starts high, spiking at $400 to $600 in the first two weeks before stabilizing at $100 to $150 by day 90. Owners who panic and turn off the lead supply at week 2 never let the curve mature, and that single decision is the silent cause of most first-year producer failures.
You hired the producer, set up the lead flow, and watched the numbers for two weeks. The cost per sale landed at $520. Your shoulders dropped and you killed the lead spend that Friday.
TL;DR
The cost-per-sale spike at week 2 is not a failure signal. It is the shape of every producer ramp curve.
New producer CPS runs $400 to $600 in the first 14 days because contact rates are still building. By day 90 that same producer stabilizes at $100 to $150 per sale if you keep the lead faucet on.
Why does a new producer's cost per sale spike in the first two weeks?
The spike is mechanical, not personal. A new producer on day one has zero pipeline and a dial rhythm that has not yet settled into muscle memory.
Contact rate on real-time leads runs half of what it will be by week 6. The closer's quote-to-close ratio is a fraction of what it becomes after they have sat through every objection three times. The math looks broken because the accounting window is too narrow. The CPS calculation on day 14 only sees the lead spend without the downstream revenue.
Industry data shows that 70 to 80 percent of new insurance producers fail within their first three to five years. The single biggest controllable factor is whether the owner funded the ramp or panicked at the first spike.
What does the 90-day CPS curve actually look like?
Weeks one and two land between $400 and $600 CPS. The closer is still learning which leads to call first. They burn a few good ones through bad tonality.
Weeks three through six drop the CPS to $200 to $300. Contact rate improves because the dial sequence is compounding. The responses start sounding natural instead of scripted.
Weeks seven through twelve push CPS below $150. The full 30-day dial sequence has matured and cross-sells begin stacking on prior new business. Pulling lead spend before day 90 guarantees you paid for the expensive part of the curve without ever reaching the cheap part.
A failed producer hire costs between $75,000 and $250,000 when you add up salary, onboarding, management time, and the accounts never pursued. A cycle of three failed producers at $150,000 each looks like a second mortgage you took out by yourself.
Why do owners kill the faucet at exactly the wrong moment?
Because the spike feels personal. The owner sat in that closer chair for years and knows what healthy CPS looks like on their own book.
Watching a new producer run at four times that number triggers a physical response. The gut says stop the bleeding. The gut is wrong because the owner's CPS is stable from a mature pipeline and automatic tonality. The new producer cannot inherit an 18-year dial rhythm. They have to build it from scratch, and the spike is the sound of that build happening.
We mapped the full producer failure rate pattern in a previous post. The single biggest controllable factor in that failure number is whether the owner funded the full ramp or killed the faucet at the first spike.
SHRM puts the cost of a bad hire at 50 to 75 percent of annual salary for entry-level roles. An agency cycling three producers at a $50,000 draw carries $75,000 to $112,500 in unrecoverable turnover cost.
The math of patience is cheaper than the math of restarting. Agency turnover runs 75 to 150 percent of a departing salary. Every time you pull the faucet you add another turnover event to your ledger.
What does funding the full ramp actually require?
Three things. First, a 90-day lead budget that nobody touches. Calculate it as 25 fresh leads per day at your average cost per lead, times 90 days. At $14 per real-time lead, that is $31,500 for the quarter.
Second, activity tracking that replaces premium tracking for the first 90 days. The producer needs 8 to 10 quoted households per day. Premium will lag but activity will not.
This is the same logic as our producer weekly scorecard framework. Third, a weekly sit-down that reviews call recordings, not spreadsheets. The owner listens to three calls and gives one piece of tonality feedback.
How do you know if the curve is working or the producer is not?
Separate the producer problem from the math problem. The curve is working if activity minimums are met and the CPS trend is down. The absolute number corrects itself.
CPS dropping from $580 to $410 to $290 over weeks 2, 4, and 6 is a working curve. If you funded 25 leads a day and the closer worked 12, the dial sequence starves. That is a coaching conversation, not a budget conversation.
This is the same pattern mapped in our producer profitability timeline and our analysis of what a bad hire actually costs. Reagan Consulting and the Big I Best Practices Study benchmark sales productivity across the industry.
CIAB research reinforces the same logic: structured development accelerates time to productivity. Cornell ILR's compensation research confirms that aligning comp systems with talent strategy improves retention and time to productivity. Your $31,500 lead budget is not the expensive part. Losing the producer after starving the pipeline is.
Sources cited in this analysis?
- Insurance Journal - New Agent Failure Rate
- The Wedge Group - Producer Failure Cost
- SHRM - Cost of a Bad Hire
- Reagan Consulting - Best Practices Study
- CIAB - Professional Development
- The Insurance Dudes - Finding and Keeping Agents
Frequently Asked Questions
How long does the CPS curve take to stabilize?
The curve stabilizes around day 90 for most new producers working real-time leads at 25 to 50 per day. CPS drops from the $400 to $600 launch window down to $100 to $150 once the full 30-day dial sequence matures completely.
Can I speed up the curve by spending more on leads?
More leads do not accelerate the curve at all during the first 90 days. They flood a new closer who has not yet built the dial rhythm to work them at full attention. The real constraint is the closer's processing capacity and tonality development, not lead volume.
What if the producer's activity numbers are strong but CPS is not dropping?
That pattern is rare but check two things before pulling the budget. First, verify lead quality at the source level to rule out bad data feeds. Second, pull five call recordings and listen for tonality failures on the close itself.
Should I tell the producer what their CPS is?
Do not share CPS with a new producer inside the first 90 days. The number will feel like judgment and shifts their focus from activity to outcome too early. Share it after the trend has been stable for at least 30 days.
Is this the same for captive and independent agencies?
The curve shape is identical across both agency models. Independent agencies often carry a higher per-lead cost without the subsidy that captive carriers provide. The ramp pattern from spike to stability tracks the same 90-day arc regardless of distribution channel.