
The Producer Scorecard That Replaces Gut Feel with Numbers
By Craig Pretzinger and Jason Feltman
Replace gut-level producer judgment with a five-number daily scorecard: dials, contacts, quotes, binds, and pipeline velocity. Agencies that track activity rather than waiting for premium reports catch performance gaps weeks before they hit commission statements. A simple spreadsheet with the right five numbers does what most agency owners never do: make producer output visible, predictable, and coachable.
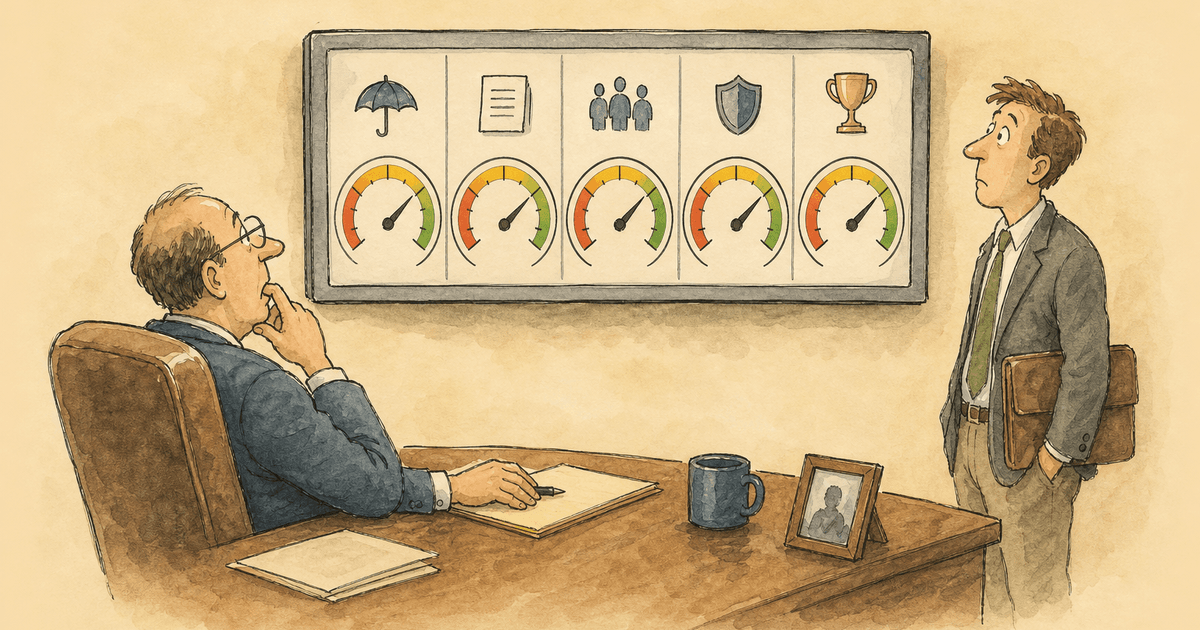
By the time premium reports tell you a producer is slipping the quarter is already gone. A five-number daily scorecard catches the same problem inside three days and gives you a coaching lever instead of a revenue surprise.
TL;DR
Daily producer activity predicts quarterly premium with a four-to-six-week lead. Track five numbers per producer every day: dials, contacts, quotes, binds, and pipeline velocity on a single shared spreadsheet. The scorecard is not a weapon, it is a coaching tool. When a producer's dials drop for three straight days, you have a fifteen-minute conversation about what got in the way, not a disciplinary meeting.
Why do most agency owners still judge producers by feel?
Picture the producer who stays late, talks a big game in the Monday meeting, and has a car in the lot before you arrive. The visual tells you they are working. The visual is lying.
Gallup research on workplace accountability found that fewer than half of leaders rate themselves as exceptional at holding everyone responsible for performance. The rest are running on instinct. Instinct cannot tell you whether the producer who looked busy all week made forty dials or four.
Insurance agency owners are not alone here. The Big I Virtual University describes measuring employee performance as "a hazy cloud for most agents and managers." Most owners "have a feeling" when someone is underperforming but cannot produce a single number to back it up. The problem compounds with scale: you can feel whether one producer is off, but you cannot feel three.
The fix is not more meetings or a tougher comp plan. It is a daily scorecard so simple you could fill it out on a napkin but consistent enough that every producer sees their own numbers before you do. SHRM research on sales compensation recommends that each sales leader should have leading indicators to determine if every rep is on track. Leading indicators are activity numbers measured today. Lagging indicators are premium reports that arrive next quarter.
What five numbers actually predict producer output?
Strip it down to five. More than five and nobody fills out the sheet. Fewer than five and you miss the diagnostic. The five numbers that move the needle:
- Dials made yesterday. Actual outbound dials from the phone system or dialer log, not self-reported fiction. Benchmark for a full-time P&C producer: 40 to 60 dials per day.
- Contacts reached. A real human on the line for 90 seconds or more, not voicemail or a wrong number. Benchmark: 6 to 10 per day at a 15 percent contact rate.
- Quotes generated. A completed application sent to a prospect or a carrier, not "working on it." Delivered. Benchmark: 2 to 4 per day.
- Binds. Policies bound yesterday. The only number that directly ties to revenue. Benchmark: a bind rate of 20 to 35 percent of quotes.
- Pipeline velocity. New opportunities added minus opportunities closed or lost. Close three and add one, and your velocity is negative two. That is a future revenue problem visible today.
These five numbers trace forward into every premium dollar you will collect next quarter. Killing Commercial's KPI framework frames activity-based KPIs as "the lifeline that keeps your team aligned with daily expectations." The logic holds whether your team sits in your office or works remote across three time zones.
How do you build the scorecard in sixty minutes?
You do not need a platform. You need a spreadsheet and a habit. Open Google Sheets, create one tab per producer, and set seven columns: Date, Dials, Contacts, Quotes, Binds, Pipeline Velocity, Notes. No pivot tables. No dashboards nobody logs into.
Each producer enters their own five numbers by 5 p.m. You review the sheet by 8 a.m. the next morning. The review takes ninety seconds per producer and you are looking for one thing: a two-day trend in the wrong direction on any single number.
One bad day is a Tuesday. Three bad days is a pattern and a pattern is a coaching conversation.
The Reagan Consulting and Big I Best Practices Study has benchmarked top-performing agencies since 1993. The study recommends picking one or two metrics that matter to your goals and starting there. You do not need to track twenty numbers. You need to track the right five numbers and look at them every single day.
What is pipeline velocity and why does it matter more than binds?
Binds tell you what already happened. Pipeline velocity tells you what is about to happen. Here is the math: every producer has a pipeline of open opportunities, each with an average close rate and an average premium. If your producer has twelve open quotes at a 25 percent close rate and a $2,000 average premium, the expected near-term revenue is $6,000.
If next week that pipeline shrinks to five open quotes, expected revenue drops to $2,500. The producer could bind two policies next week and still be shrinking. The producer who just had their best month might also have an empty pipeline. They will have their worst month thirty days from now and you will not see it coming unless pipeline velocity is on the scorecard.
Pipeline velocity turns a gut-level "something feels off" into a number you can act on. When velocity goes negative, you know exactly which stage of the funnel is leaking before it shows up as a revenue miss.
What coaching moves does the scorecard unlock?
The scorecard is the conversation starter, not the conversation itself. Each pattern points to a specific fix:
If dials are high and contacts are low, the list is bad or the phone system is flagging the caller ID. Check your spam-flag defense setup before you coach the producer.
If contacts are high and quotes are low, the opener is weak or the producer is getting stuck in conversations that never move to a quote. Listen to three calls. The problem lives in minutes two through four.
If quotes are high and binds are low, the closer is broken. The producer can get a prospect interested but cannot get a check. Listen to the last five minutes of every call that got to a quote but not a bind.
If pipeline velocity is negative, the producer stopped prospecting and is working only the deals already in hand. This is the single most common failure mode for producers who look busy. Pair this with a weekly accountability meeting to re-anchor the prospecting habit.
Every number maps to a specific coaching lever. Without the numbers, you walk into the conversation with "you need to sell more" and the producer walks out unchanged.
Does a scorecard kill producer morale?
Only if you use it wrong. Gallup's research on accountability found that unclear or misaligned expectations are one of the top reasons employees do not take responsibility for outcomes. A scorecard that uses the same five numbers for every producer removes ambiguity about what "good" looks like.
The rule: the scorecard is never public shaming and never read aloud in a team meeting. The Cornell ILR School's research on performance management reinforces that metrics must be fair, differentiated, and growth-oriented to drive performance rather than resentment. Pull the bottom performer aside privately, pull up their numbers, and ask one question: "Which of these five numbers do you think we should work on this week?" Let them pick the lever. If they own the fix, they own the result.
Scorecard adoption follows a predictable curve. Week one, producers resist because it feels like micromanagement. Week three, they start checking their own numbers before you do because the correlation between dials and commission checks becomes undeniable. Week six, the producer who was most resistant is the one asking if you saw their pipeline velocity yesterday.
Sources cited in this analysis?
- Reagan Consulting / Big I Best Practices Study - benchmarking data on key metrics of agency performance since 1993
- Killing Commercial - KPI-Driven Strategy for Insurance Agencies - activity-based KPIs aligned with core values for remote and in-office teams
- Gallup - Accountability in the Workplace - fewer than half of leaders rate themselves as exceptional at holding everyone responsible
- SHRM - Monitoring Sales Compensation - leading indicators help sales leaders determine if each rep is on track
- Big I Virtual University - 3 Sales Measurements - retention ratio, closing ratio, and effective production time
- Big I Virtual University - Measuring Employee Performance - objective measurement framework for agency roles
- Big I / Reagan Best Practices - pick one or two metrics that matter and start tracking
Frequently Asked Questions
How fast will a daily scorecard show me a producer is struggling?
You will see a two-day activity drop by day three. A revenue-only view catches the same problem six to eight weeks later when premium reports update. That is a five-to-six-week head start on fixing the issue before it hits commission statements.
What if a producer refuses to fill out the scorecard?
Ask them what is uncomfortable about it. Most resistance is fear that the numbers will be used against them. If you have a producer who refuses any form of activity tracking, you have a producer who does not want to be managed. That is a different conversation.
Can I use the same scorecard for a CSR or a service agent?
No. A producer scorecard tracks outbound activity and pipeline. A service agent scorecard tracks retention rate, response time, and cross-sell appointments which is a different scorecard entirely. The principle is the same: five numbers, every day, used for coaching not punishment.